Performance Testing a data pipeline at scale
Written by Sushant Soni
Introduction
At VWO, we get traffic at a very high throughput (22K req/sec) to our servers. The data pipeline crunches and transforms the data into meaningful information and stores it in the database. We recently started building another data pipeline to scale things up.
Apart from the functional aspects, the QA team must ensure that the data pipeline performs well without compromising the integrity, completeness, accessibility of the data, and the cost incurred in obtaining it.
To better understand the performance of the system, we will logically divide the data architecture into two parts: the Read Layer and the Write Layer. This blog discusses mainly the Write layer. It comprises the DACDN -> Google Cloud PubSub -> Google Cloud Data Flow -> Data Sinks (BigQuery, Apache Druid, PostgreSQL).
Architecture in brief
- DACDN (Data Acquisition and Content Delivery Network): This service at VWO is responsible for serving content to visitors as well as collecting the data.
- Google Cloud PubSub: Pub/Sub is a fully-managed real-time messaging service that allows you to send and receive messages between independent applications. You can use Pub/Sub as messaging-oriented middleware or event ingestion and delivery for streaming analytics pipelines.
- Google Cloud Dataflow: Dataflow is a fully managed streaming analytics service that minimizes latency, processing time, and cost through autoscaling and batch processing.
- Data Sinks: These are the databases in which the data is stored ultimately, after various transformations.
Performance Test Plan
Having a concrete testing plan before starting a performance test is essential. It helps in concluding the test in a timely and organized manner. We outlined the following approach for our performance testing activity.
- Baseline test: A baseline test is conducted to compare the performance of the system with its historical performance. We decided to go with the current production metrics for the throughput of various APIs as a baseline.
- Load test: After getting the throughput metrics from production, the load test was conducted for 2x, 3x of the baseline, which we increased to 5x.
- Spike test: As our Google Cloud DataFlow pipeline automatically scales up based on the throughput, we conducted spike tests to account for the unintentional behavior during spikes.
- Stress test: We conducted a stress test to find out the breaking point of the system.
Performance Test Setup
We have some prior experience in performance testing as we have done it for our earlier data pipelines. But this time, we wanted to overcome the shortcomings in our previous approach.
Performance Testing Tool
We have been using Apache JMeter a lot for our functional and performance testing. But JMeter has its limitations in reporting and real-time monitoring. Also, there is a tedious setup involved with JMeter if we want real-time monitoring of the metrics (can be done with JMeter backend listener, InfluxDB, and Grafana). However, this setup was unsuccessful due to several reasons which are out of the scope of this blog.
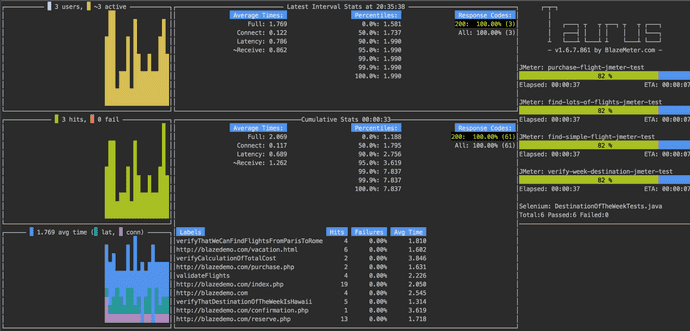
Hence, we researched many performance testing tools available in the market and decided to go with Taurus. Apart from the distributed setup, reporting, and real-time monitoring advantages, we chose Taurus as the team had prior experience in scripting in Apache JMeter, and Taurus can run the same JMeter scripts without any issues. There would have been a learning curve involved if we had gone for any other performance testing tool.
Load calculator
Due to the nature of the business VWO is in, we need to keep the data accurate, even at a larger scale. We must know the exact number of various API calls made to the server so the same can be validated after the load has ended. For this, we created simple load calculators in Google Sheets using different Mathematical functions.
Given the number of users/threads and the number of days for which the visitor data would be simulated, the calculator would give us the exact number of API calls for each sampler and the duration of the test for given values.
Documentation of the test results
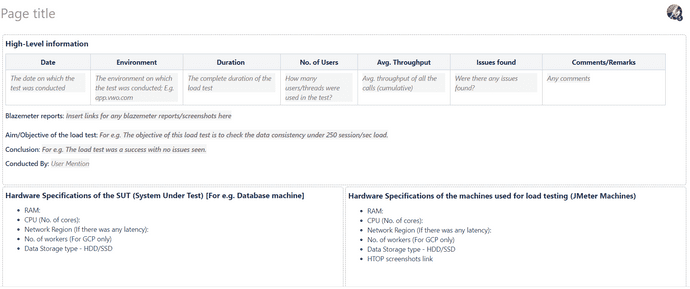
Performance testing is incomplete without the documentation of test results. Create report templates as per your business requirements, which are easy to understand and yet provide a detailed description. We created the following load testing report template.
With Taurus, the reporting part is partly taken care of as it provides the reporting functionality from Blazemeter for free which is available for 7 days.
Calibration
Calibration is done initially to get the highest amount of load from your test scripts as well as the test machine (The machine on which the load scripts will be running). There is only a limited number of users that a machine of a set configuration can handle. One must know the optimum amount of load/throughput that can be generated from a machine.
Monitoring
As we are interested in the performance of a data pipeline, some key metrics for us are:
Lag
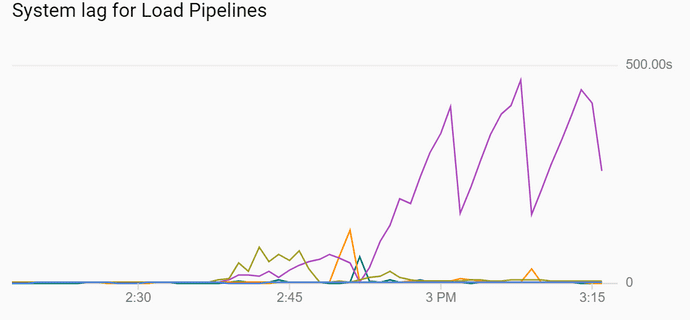
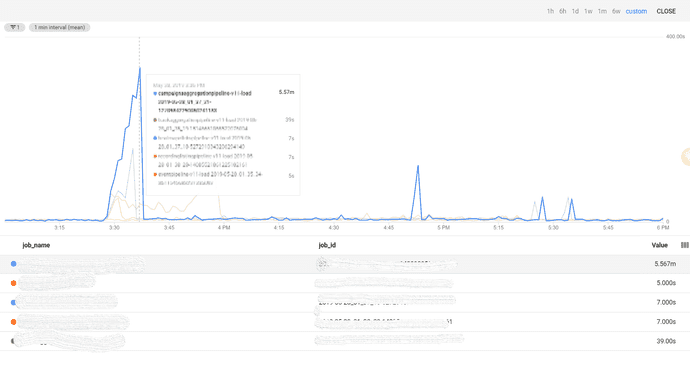
Lag for Google Cloud DataFlow is the maximum time that an item of data has been awaiting processing. Increased lag in the system has consequences including but not limited to data freshness.
The most recent data sent to the system will not be available for reading and it indicates a problem that the messages are not being consumed at the same or greater rate as they are being pushed into the system.
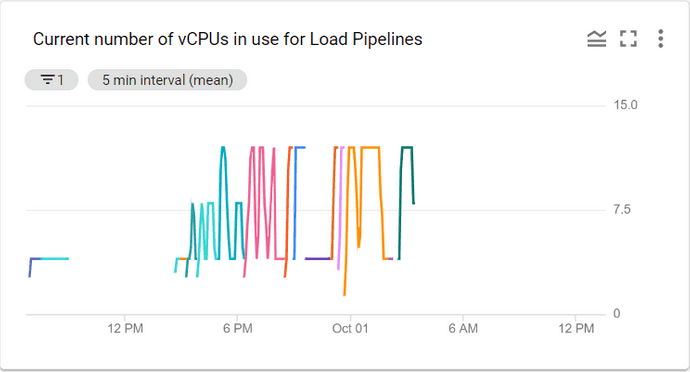
Number of vCPUs in use for a pipeline
This is the number of vCPUs in use by a pipeline, as we have used Google Cloud DataFlow in our data pipeline which scales automatically depending upon the system throughput. We must know when the pipeline scales.
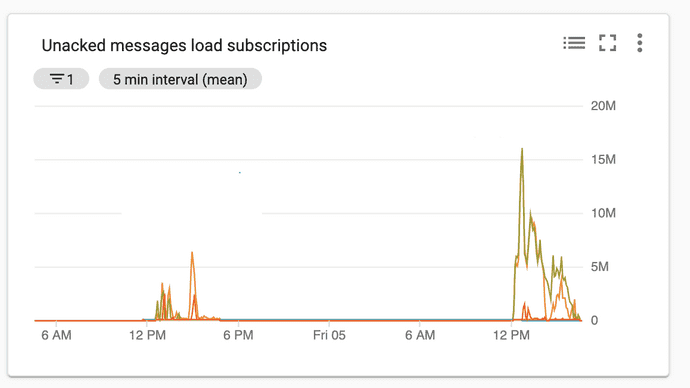
Number of Unacknowledged messages in PubSub
For a running pipeline, ideally, this number along-with the system latency metric should remain bounded in a range decided as per business requirements.
We can see below that unacknowledged messages reached a peak of 16 Million during one of the load tests.
Issues observed
Data Duplication
One of the critical issues we observed that the data in our database was getting duplicated. For some messages we have sent to Google Cloud PubSub, we received them twice/found them duplicated. With Cloud Pubsub, unlike Apache Kafka, we cannot seek a particular message offset and consume data from there. As a result, in case of failures, retries, and upscaling/downscaling of machines, Pubsub/Dataflow can not guarantee exactly-once writes for sinks that are not idempotent.
Our team had to add a de-duplication logic to remediate this issue.
Cost Inefficiency of the solution
Google Cloud Platform gives us a detailed overview of the billing and charges based on our usage. During our load tests, we found out that certain services in our data pipeline would be too costly on higher visitor traffic. Naturally, we found this out early and remediated the issue by changing our architecture.
Load test scripts inefficiency
Not every time we find the problems in the SUT (System Under Test).
In the early stages, we found that the load test scripts we created were a memory hog. Despite using all the machine’s memory, the scripts could not generate enough load. We debugged and found out potential issues related to the problem. See the best practices section in this blog for more on this.
Data Loss
We observed data loss in the system at a very high load. One of the primary reasons for this issue was the high number of update transactions in PostgreSQL. The dead tuples were getting created at a higher rate than they were getting cleaned by the auto-vacuum daemon. This resulted in bloating of the database which subsequently leads to data write being stopped.
Summary
Performance testing should be planned carefully and done in an organized manner. We should start it in the early stages of the software development process as it helps in uncovering some of the most critical bugs, which otherwise may prove catastrophic in the future.
Best practices for Apache JMeter
- Always use the latest version of Apache JMeter.
- Use the non-GUI mode.
- Minimize the use of conditional logic (If statements) in your load test scripts.
- Use JSR223 components instead of Beanshell wherever possible.
- Disable the View Results Tree, Debug Sampler, and Summary Report components during the load test.
- Use the caching option if you don’t have a direct reference to a variable.


