## Performance Benchmarks
Below stats are a rendition of the Chrome (version 37) timeline for the following use case:
A table containing 216 rows repeated by q-repeat. Each row has about 10 columns containing about 50+ Angular directives each (Original). The optimized version has those Angular directives replaced with q-directives, and ng-repeat is replaced by q-repeat.
Data is collected over 5 samples for both Original and Optimized situations.
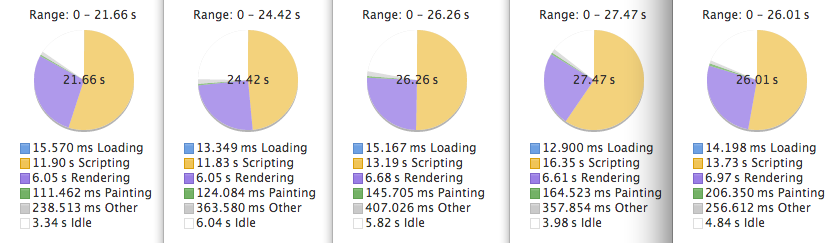
### Initial table render
#### Original
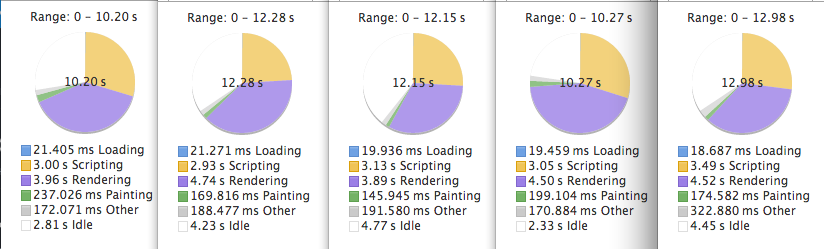
#### Optimized
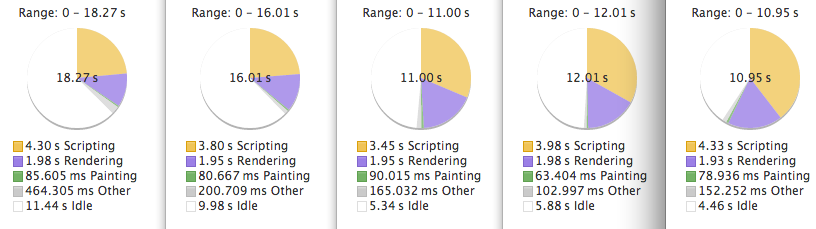
#### Optimized (+ disabling ngAnimate)

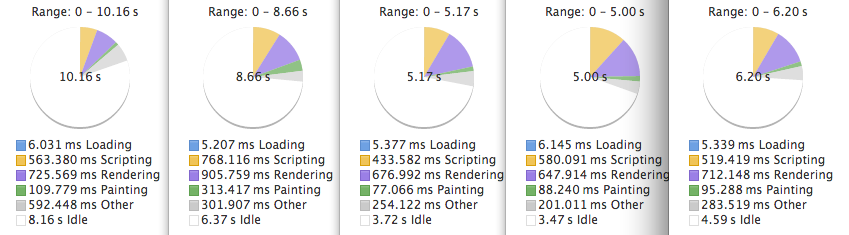
### Sorting the table
#### Original
#### Optimized
More benchmarks coming soon...