Computing Aggregates in VWO
Written by Anil Mor
Introduction
In VWO, we present clients with information about the data of their users' events in aggregated form on their dashboard. Aggregates are calculations performed on a set of events using a specific aggregate function, based on specified conditions. In the VWO world, aggregates are also called metrics, which the client defines. Let's examine the journey of a visitor on an e-commerce platform. When a visitor lands on the product page, they may make the purchase. This can be viewed as a two-step process. There are two key business metrics to track: the number of visitors who land on the product page and the number of visitors who complete a purchase. By plotting these numbers on a daily basis, we can identify any trends that may exist. These numbers seem pretty straightforward in computation. But things get tricky when you give the freedom to apply any sort of conditions to your client to compute any sort of metrics.
For example, (Conditions)
compute only when
- The visitor is a female
- And the visitor is from India
- Or the visitor has placed an order with a minimum value of $499.
(Metrics)
And compute the below metrics:
- The overall number of such scenarios.
- The number of unique visitors involved in such interactions
- The total value of items sold during these interactions
- The total quantity of items sold during these interactions.
How we were doing it earlier:
We used to calculate metrics in VWO using Postgres. However, our previous method was limited as it only involved simple calculations and a small number of metrics. We had a day-wise table with a few columns as metrics, and the pipeline would process raw events to update the counters in the table.
Limitations of the previous implementation:
- The client did not have the flexibility to create custom events and custom metrics.
- Unique visitor tracking was accomplished using client-side cookies and was not incorporated into the pipeline.
To address the limitations mentioned, we implemented an event-streaming architecture for the product. We now store raw visitor events in Google BigQuery and Clickhouse. This allows for real-time calculation of custom reports without the need for storing specific data.
Why can’t we power up metrics from Bigquery and Clickhouse?
BigQuery is a very powerful tool to run very complex SQL queries on very large datasets. But it takes a few seconds to give results. The SLA for aggregate computation was in sub-seconds. So we could not use Bigquery for this reason.
ClickHouse is an open-source column-oriented DBMS for online analytical processing that allows users to generate analytical reports using SQL queries in real time. Initially, we powered up the metrics with Clickhouse, but over a period of time with continuously increasing data and continuously increasing parallel queries, we noticed that ClickHouse consumed more and more CPU resources to perform these computations. We knew ClickHouse will not sustain against the aforementioned conditions for a number of reasons:
- Our computations combined with business logic were quite complex to perform on raw event data.
- Clickhouse performs better when we directly aggregate the data without too many conditional transformations.
Our experience with Clickhouse showed that it would be challenging for any system to process raw events in real-time and deliver results in sub-seconds with limited resources. Therefore, we focused on creating a system that can compute metrics during data ingestion (at the time of writing the data) instead.
What were some common parameters, we seek a solution for?
- We needed to provide metrics at the visitor level, such as the amount spent on a visitor's first purchase.
- We also had to compute metrics based on the uniqueness of visitors, such as calculating metrics only for unique visitors. This required a deduplication service to determine whether a visitor had been seen before.
- Clients can define N number of metrics, we can’t choose SQL because there the table schema would be fixed.
How did we arrive at BigTable?
- In our existing ecosystem, ClickHouse and Bigquery are OLAP databases that are not good with update operations. As the events and metrics can both be defined by the client, it would be challenging to implement this data structure in a SQL-based database.
- Bigtable also has an inbuilt increment operator support which proves beneficial in terms of performance to increment metric counters concurrently from many threads.
- We did not want to add 1 more database to the existing ecosystem, unless necessary. We were already using BigTable for some other scenarios, so it became our preferred choice.
What BigTable brings to the table for us?
- A fully managed, scalable NoSQL database service for large analytical and operational workloads with up to 99.999% availability.
- Consistent with single-digit millisecond latency
- Seamless to scale to any storage and throughput.
- Highly available with multi-primary replication.
- Easily connect to Google Cloud services or the Apache ecosystem.
Implementation Using BigTable and Redis:
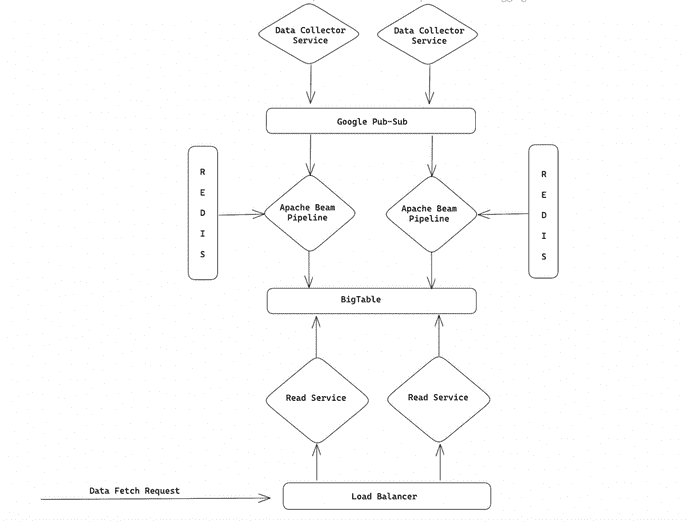
The below diagram (Figure 1) gives an abstract idea of the data ingestion pipeline which is storing aggregated metrics in BigTable.
Figure 1: High-Level Design of Aggregation Framework
As per the architecture diagram (Figure 1), We have a streaming write service using Apache beam framework to compute these metrics from the incoming traffic data in real-time. We store the computed day-wise metrics in Bigtable. Then the read service powers the VWO dashboard using these computed numbers.
In what ways is Redis integrated?
We have utilized Redis, an open-source in-memory data structure store, to serve as a side input for our ETL pipeline. This allows us to provide the pipeline with all the necessary meta-information to compute metrics as defined by the client. As the data is frequently used in the streaming pipeline, Redis is the ideal choice due to its low latency and ability to function as an in-memory store
Performance Numbers and Benchmarks:
When Metrics are Powered through ClickHouse:
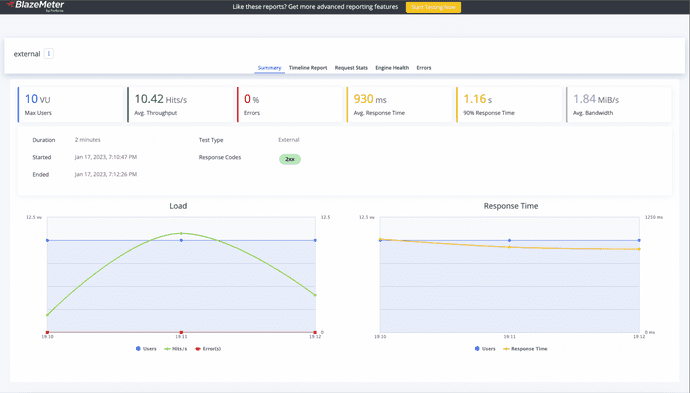
As stated in the article, ClickHouse is known to be a highly CPU-intensive database when computing raw data, resulting in slower query performance. This was also confirmed through our benchmarking tests, where we found that when hitting 10 REST APIs concurrently using Clickhouse, the average response time was 930 ms, and 90% of the requests took over 1.16 seconds. Below(Figure 2) is the BlazeMeter report stating the same.
Figure 2: Stats of Load Test-1 (When metrics are powered through ClickHouse)
Clickhouse’s CPU stats while benchmark test:
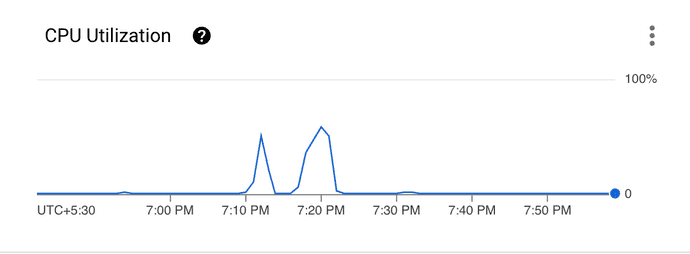
The statistics below(Figure 3) demonstrate that the CPU usage of the ClickHouse cluster, which consisted of 3 VMs with configurations of 32 cores and 32GB each, was around 50% during the benchmark test, supporting our hypothesis.
Figure 3: CPU utilization of ClickHouse's cluster during the load test
When Powered through BigTable:
During the benchmark tests(Figure 4), we employed a single-node BigTable cluster with 5 GB SSD. In the initial test, which ran for 7 minutes from 5:45:10 PM to 5:53:31 PM (time included to facilitate the Bigtable statistics provided below), we hit 20 REST APIs concurrently powered by Bigtable. The average response time was 31 ms, with 90% of the requests taking 49 ms. During this test, Bigtable's CPU usage was approximately 5%(Figure 6), with 14,000 rows read per second and 160 requests per second (Figure 7 and Figure 8).
Figure 4: Stats of Load Test-2 (When metrics are powered through BigTable)
In another benchmark test(Figure 5) that ran for 7 minutes from 5:37:20 PM to 5:44:33 PM (time included to facilitate the Bigtable statistics provided below), we hit 40 REST APIs concurrently powered by Bigtable. The average response time was 30ms, with 90% of the requests taking 45ms. During this test, Bigtable's CPU usage was approximately 7%(Figure 6), with 28,000 rows read per second and 320 requests per second (Figure 7 and Figure 8).
Figure 5: Stats of Load Test-3 (When metrics are powered through BigTable)
BigTable’s monitoring stats while benchmark test:
Figure 6: CPU utilization of BigTable's node during the load tests
Figure 7: Read requests of the BigTable's node during the load tests
Figure 8: Rows read of the BigTable's node during the load tests
Limitations:
As we process the real-time data, we evaluate the given metrics from the raw events based on the conditions defined by the client. We do not and would not be able to compute “AND” conditions which are based on two different events such as addToCart and checkedOut as illustrated below. For example, we won’t be able to support conditions like
however we support the “OR” condition between different events.
Conditions which can be evaluated from a single event, are being supported because while processing events in real-time and computing conditions based on them, we don't process historical events. Even if we try to store the historical events, it will increase our system cost multifold. If we keep aside the cost, the logic to solve this case will be very complex to build. Rather, solving such cases using ClickHouse will prove more efficient, both in terms of resources and technical difficulty. Thus the AND operation of two events can not be supported.
Conclusion:
- We designed an alternate process to compute dynamically defined metrics that are computed in the data ingestion pipeline using BigTable.
- We reduced the API response time from sub-seconds to approximately 30 ms for our production load.
- We reduced our System cost by not computing metrics at the time of reading data from Clickhouse. This is attributed to the high CPU-intensive architecture of Clickhouse.


