
Getting 60 FPS using Chrome devtools
Written by Kushagra Gour
This post is about making your web page perform better using a real world example. As you know, we recently launched a very cool animated comic on A/B Testing. It is scroll animation describing what is A/B testing. I'll talk about it as an example and walk you through its performance issues, how we debugged them and finally what we did to extract 60 FPS out of it.
The process we see in following text will applies more or less to all web pages in general. Here's what you need to get started:
- A janky web page.
- Google Chrome with its awesome devtools.
- Determination to make it run as smooth as a hot knife through butter :)
Worry not if you are missing any of the above, you can still read on. Let us begin.
WHAT is causing the issue?
All we know now is that our page is janky. When you scroll up/down you'll notice that the animation is quite choppy. There are sudden jumps occasionally while scrolling which is really irritating and obviously a bad user experience. We don't know what is causing this. The very first step we take here is profile the page using Chrome devtool's Timeline feature. So I went on and fired up my devtools.
Open the devtools
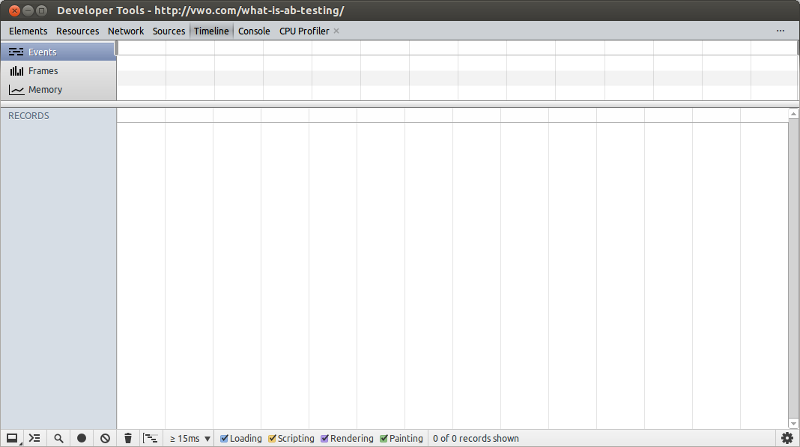
Devtools in chrome can be fired either going to Tools > Developer Tools or using the shortcut Ctrl + Shift + I on Windows/Linux and Cmd + Opt + I on Mac.
Select frames tab
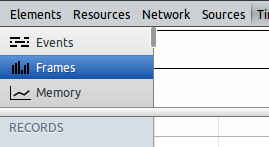
Frames tab basically will let us visualize each frame individually showing how much time was taken by that frame and for what tasks.
Filter out events taking more than 15ms
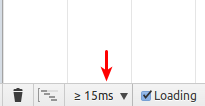
Note that we are targeting 60 FPS here. A little math here gives us the number
16.666 ms (1 / 60 * 1000). This is the time budget available per frame to
do its thing if we want a consistent 60 FPS.
Therefore, we essentially want to investigate those frames which are crossing this time limit. To do so, select the >= 15ms option from bottom bar as shown.
Record
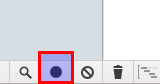
Press the 'Record' button at the bottom to start devtools record what's happening on the page. Once you do that, go back to the page and interact with the page as one would normally do exposing the issues we are trying to debug.
In my case, the page was feeling choppy while scrolling between slides. So I simply kept scrolling on the page like a normal user. After interacting for a while with the page, I get back to the devtools window and press the same button to stop the recording.
Notice the frames
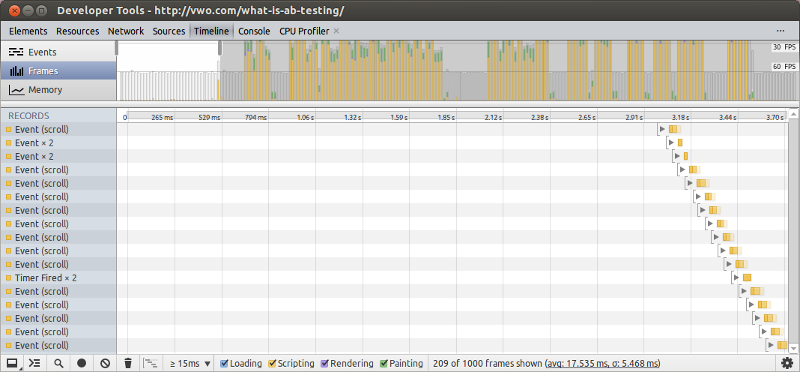
You now see the frame data for your page... something like in the snapshot above. In the image you'll notice a vertical limit with the label 60 FPS just below the label for 30 FPS. These limits are for the frames under which they need to do their stuff if the respective framerate is to be achieved. Once you know this, you'll straight away conclude that almost all of our frames our crossing that limit like hell! This is the point where we have actually visualized and confirmed the issue. Lets find out the cause.
Script events taking more than 15ms
Every frame's bar is made of different colour components. In the above snapshots we see only yellow and green ones. A quick look at the color legend in the bottom bar tells us that yellow is script time and green is painting. A closer analysis tells us that most frames are in majority made up of yellow component. This means that most of the frame's time is spent in executing script.
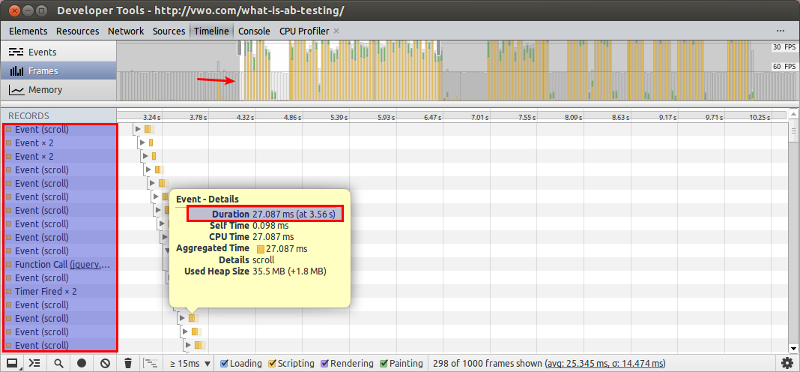
Moreover if you hover over any small horizontal yellow bars below, as show in the snapshot above, you'll also see the exact time that our scripts are taking per frame along with the corresponding event that triggered it. In my case, it's the scroll event (we expected that...no?). Some of those scroll events are taking upto 27 ms which is much much more than our budget of 16ms per frame.
Issue detected: Scroll event script
After all this analysis using the devtools we hence come to the conclusion that it's the script executing for every scroll event that is the cause of issue here. Next step in our debug process is finding WHY it is causing it.
WHY is it causing an issue?
Let's investigate the code
Our code for the callback bound to the Scroll event is as follows:
$(window).scroll(function() {
    var currentScroll = $(this).scrollTop();

    // Set the position to current slide if the user scrolls manually.
    checkpoints.forEach(function(checkpoint, index) {
      if(currentScroll <= checkpoints[index] && currentScroll > checkpoints[index - 1])
        i = index;

      if(currentScroll < checkpoints[1])
        i = 0;

      if(i == checkpoints.length - 1) {
        $("#main_form, .social-icons").css("visibility", "visible");

        $("a#scrollDown").fadeOut();
        $("a#autoscroll").fadeOut();
      }
      else {
        $("#main_form, .social-icons").css("visibility", "hidden");

        $("a#scrollDown").fadeIn();
        $("a#autoscroll").fadeIn();
      }

      if(currentScroll > 0)
        $("a#scrollUp").fadeIn();
      else
        $("a#scrollUp").fadeOut();
    });
});
This callback function will be our target from now on.
Scroll event is too frequent to handle scripts taking time
First thing that striked me was that the Scroll event is fired too frequently. Every time you scroll on a page, that event is fired multiple times within seconds. Therefore any code that is attached to the Scroll event will be fired with the same frequency. And if that code is computation heavy, we are done!
FIX
To improve the situation here, we have 2 ways:
A. Make the Scroll event fire less frequently B. Optimize the callback's code to take less execution time
FIX A. Make the Scroll event fire less frequently
I could make the Scroll code fire less frequently in our case as it did not had any usability hit. In fact mostly the code thats required to be executed on Scroll event can be run on little longer intervals without any user experience loss.
This thing was easy to do. Ben Alman has an awesome jQuery plugin written for throttling/debouncing functions. Its very easy to use too. Simply get the plugin into your page and pass the throttled function to Scroll event like so:
var callback = function () {
  ...
}

$(window).scroll( $.throttle(350, callback));
As you see in above code, I have made my callback to fire atmost once within 350 ms. In other words, there will be atleast an interval of 350 ms between 2 calls to that function. This should probably keep those adjacent long yellow bar at some distant from each. We'll see.
TEST!
We made a small change from our side. But remember, there is no point of it without actually testing the page and getting a performance boost. So lets repeat the profiling procedure again.
Here is what we got this time:
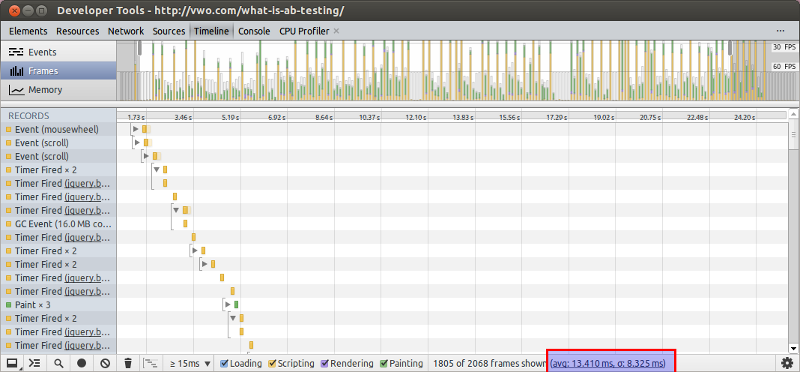
Seems to have worked quite a bit! We have lesser frames overshooting the 16ms budget.
FIX B. Optimize the callback's code to take less execution time
Secondly, its also important to optimize the code inside that callback at that is what is causing the frames to go beyond our 16ms budget.
If you look closely inside the callback's code and have a basic understanding of what not do while jQuery, you'll see some horrible things happening there. I'll not go in much details on why those things are bad as our focus is on using devtools in this article. Lets list out what all jQuery menace we see in it:
- Cache jQuery objects
At many places, jQuery is being used to reference element by passing their selectors again and again in the callback. That is BAD. Unless these references will change in future, its wise to calculate them once and cache for future use.
Some of the lines where jQuery is being used unnecessarily:
var currentScroll = $(this).scrollTop(); // this is always window object $("#main_form, .social-icons").css("visibility", "visible");
$("a#scrollDown").fadeOut();
$("a#autoscroll").fadeOut(); $("a#scrollUp").fadeIn(); $("a#scrollUp").fadeOut();- Unnecessary animation
Have a look at the following code snippet:
if(i == checkpoints.length - 1) {
  socialIcons.css("visibility", "visible");

  scrollDownBtn.fadeOut();
  scrollAutoBtn.fadeOut();
}
else {
  socialIcons.css("visibility", "hidden");

  scrollDownBtn.fadeIn();
  scrollAutoBtn.fadeIn();
}
The first if checks if we are on the last iteration of the loop or not. If not, then the else part executes. Which means if the loop runs 100 times, 99 times the else part executes. Moreover if you see carefully the code in the else block, it will keep fading in/out certain elements on each iteration, even when it has done the same thing in past iteration. Taking account the heavy animation account cost in jQuery, this is absolutely unnecessary work being done here.
We could simply do that stuff once and set a flag which will be checked next time and we only do it again if the flag is unset somehow.
Final code
After the above 2 fixes, here is how our Scroll event callback looks like:
function scrollHandling() {
  var currentScroll = $window.scrollTop();

  // Set the position to current slide if the user scrolls manually.
  checkpoints.forEach(function(checkpoint, index) {
    if(currentScroll <= checkpoints[index] && currentScroll > checkpoints[index - 1])
      i = index;

    if(currentScroll < checkpoints[1])
      i = 0;

    if(i == checkpoints.length - 1) {
      socialIcons.css("visibility", "visible");

      scrollDownBtn.fadeOut();
      scrollAutoBtn.fadeOut();
      lastSlideUIapplied = true;
    }
    else if (lastSlideUIapplied) {
      socialIcons.css("visibility", "hidden");

      scrollDownBtn.fadeIn();
      scrollAutoBtn.fadeIn();
      lastSlideUIapplied = false;
    }

    if (currentScroll > 0) {
      scrollUpBtn[0].style.display == 'none' && scrollUpBtn.fadeIn();
    }
    else {
      scrollUpBtn.fadeOut();
    }
  });
}

$window.scroll( $.throttle(250, scrollHandling));
TEST AGAIN!
Needless to say, our next step is to test the changes made. Here is what the timeline says now:
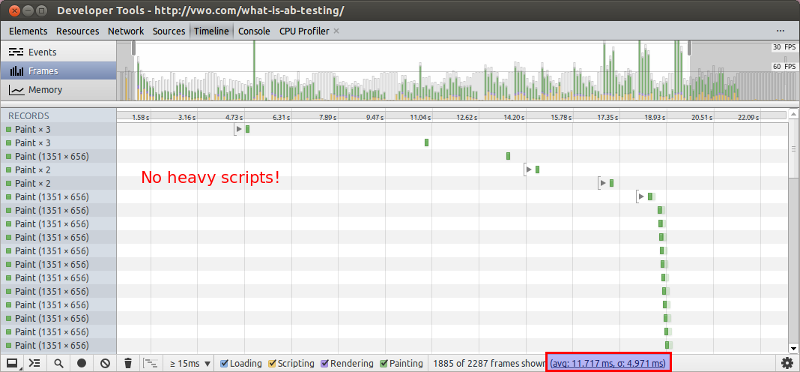
Bingo!
- We hardly have any frames overshooting the target line of 60 FPS.
- We get an average execute time of 11.71 ms per frame with a standard deviation of around 4.97 ms.
Going further
We still see paint (green) events which are causing some frames to overshoot the border. It is basically on slides where large image are being animated on the screen. Its not that we can scale down the images or stop them from being painted. The solution still needs to be figured out to optimize the painting going on here. Suggestions?
Last words
As Chrome folks say it, don’t guess it, test it!